General Analytics
Chat Statistics
We can analyze the chat trends here like the number of chats, missed, and answer. Even the average response time is also available here.
As soon as you jump on to Chat analytics, you can select the time for the information to show.
We can analyze chat trends such as the number of chats, missed, and answer. Even the Average response time is also calculated.
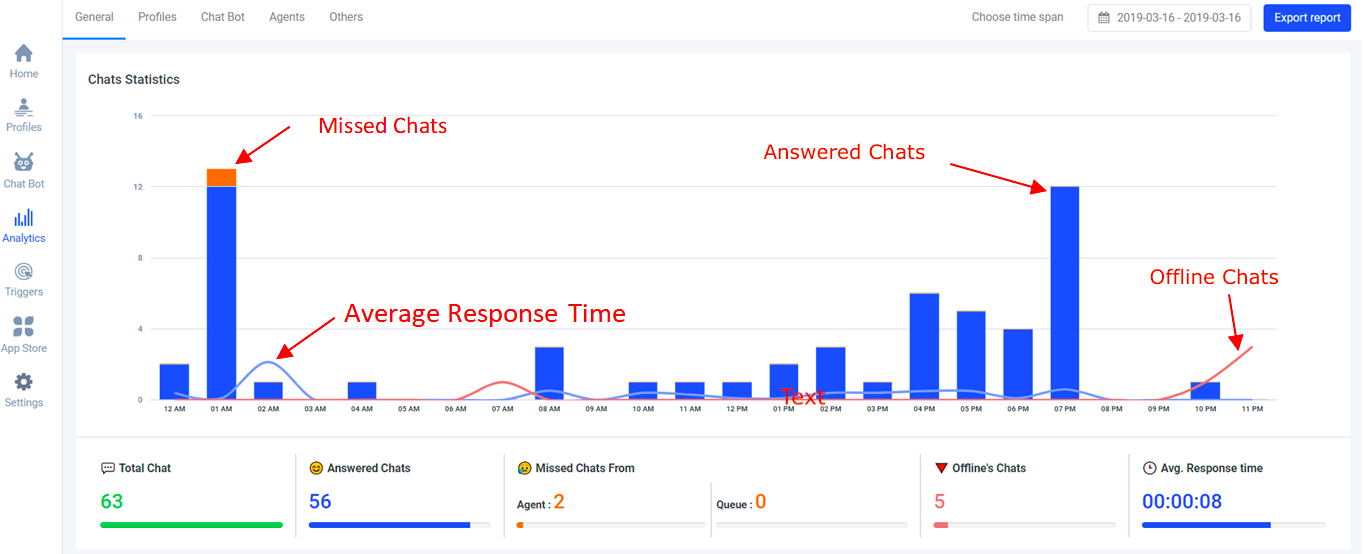
The orange portion of the bar graph denotes the missed chats, and the blue part indicates the Answered Chats. The thin, light blue line running through the chart shows the Average response time & thin red line shows offline chats of Bar graph.
Below this graph, you can have a look at the Total number of chats, Answered chats, Missed chats, Queue, Average Response time & Offline’s chats.
Average Chat Time
Here we can have a look at average chat handling time or as called as AHT(Average handling time).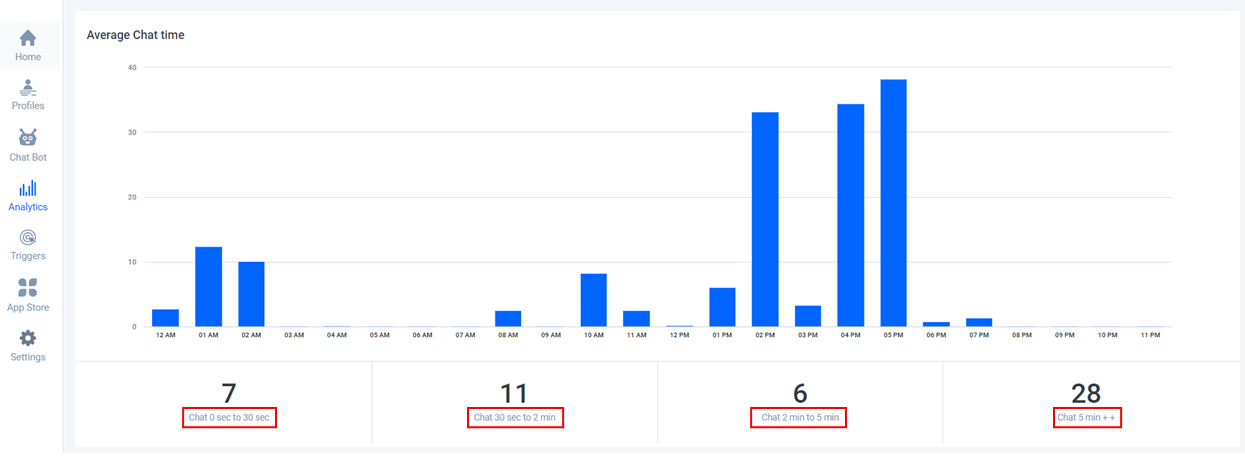
Just below the bar graph, we are able to split up of chat groups for chats that were between 0-30 seconds, 30 seconds -2 minutes, 2-5 minutes, and chats above 5 minutes.
The average is calculated by chat duration (meaning the chat end time minus the chat start time) divided by answered chats.
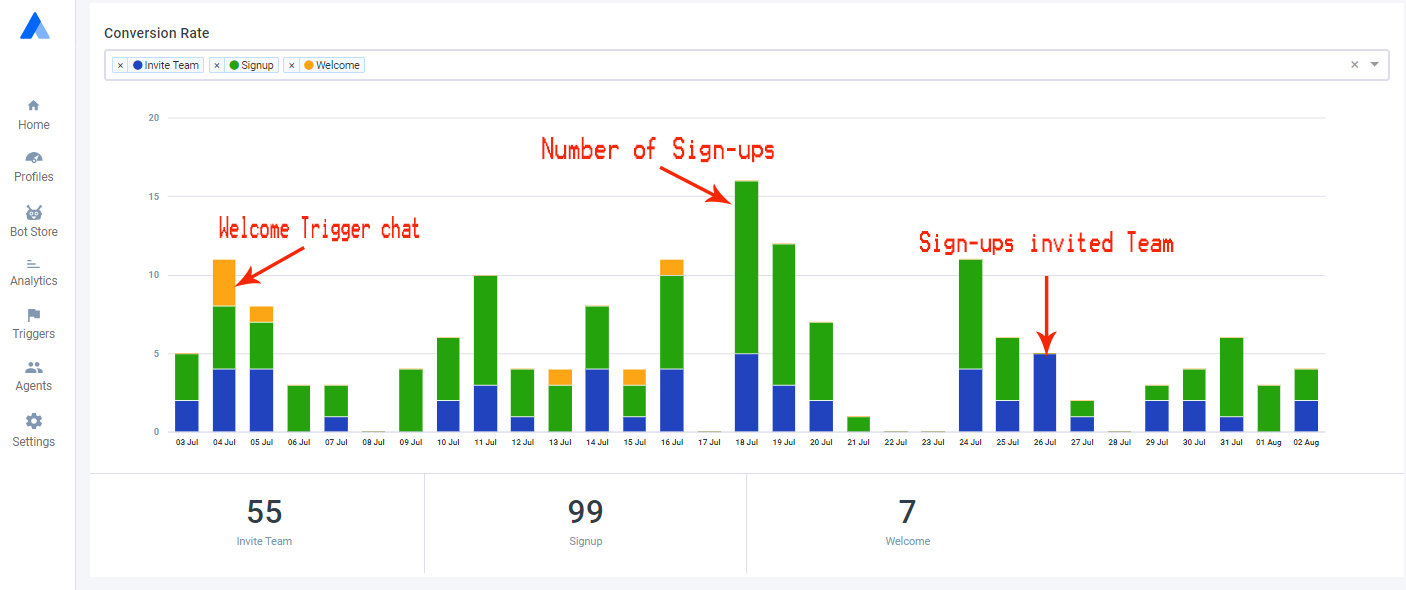
Conversion Rate
Here we can access the conversion rate for the visitors we have, that are successfully converted to potential leads.
You will be able to track all the chats that led to a sale using the goals feature. You can set up any beneficial conditions you want to reach.
Tags and Customer satisfaction
Here we can have a look at what tags are used while saving a lead to CRM, and these tags would help us to bucket the chats accordingly. Also, we can analyze customer satisfaction and happiness through the feedback provided.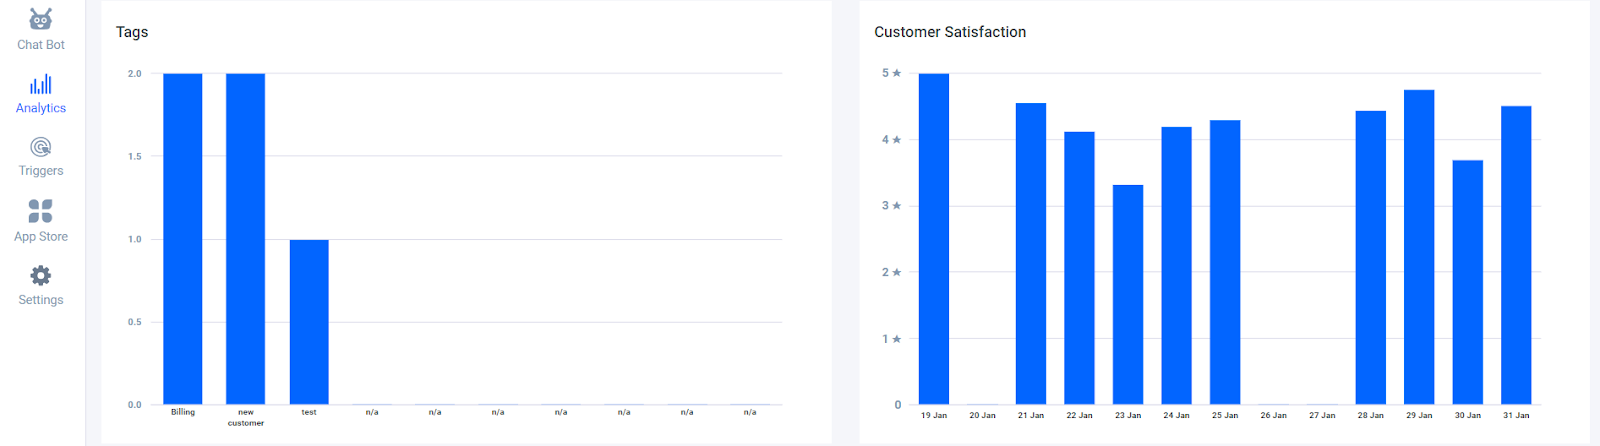
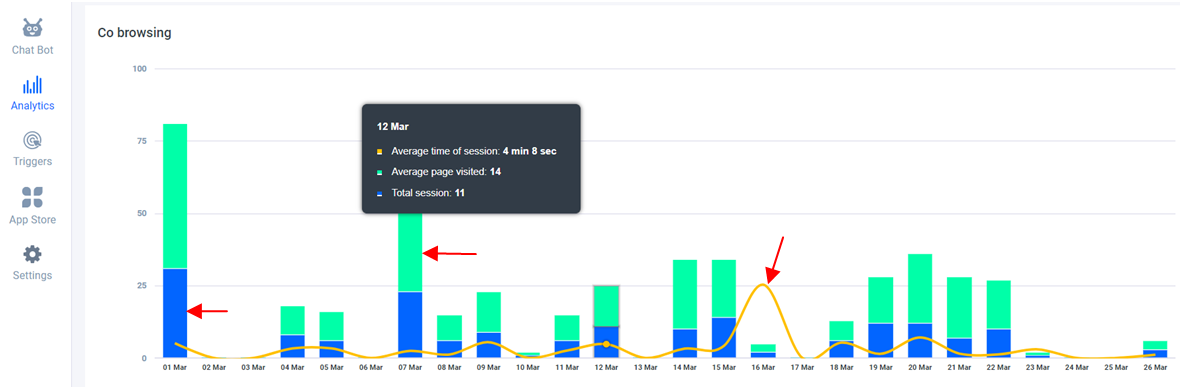
Co-browsing
Here we can have a look at Total session of Co-browse initiated(Blue bar), Avg page visited(Green bar) & Avg. Time of session of Co-browsing (Thin line).